Overview
Static pool or "vintage" analysis has long been used by the financial services industry to evaluate
lifetime losses of lending pools and provide, to an extent, the probability of future trends of
expected losses. The term "vintage" is sometimes used as an analogy to the wine industry and the
rating or quality of wines based on their harvest year. This type of analysis is especially useful
when you can identify a large specific group of entities, be it customers, loans, widgets, and can
track the key metrics at specific points in time. Though this has been leveraged heavily in the
finance industry, it is rarely seen in other industries and could be a new tool in your toolbox to
better track your organization's performance over time.
Let's take a high-level example to illustrate the basics. Say I'm a lending analyst at a bank and I
would like to monitor the risk ranking decisions over time.
Setting Up the Analysis
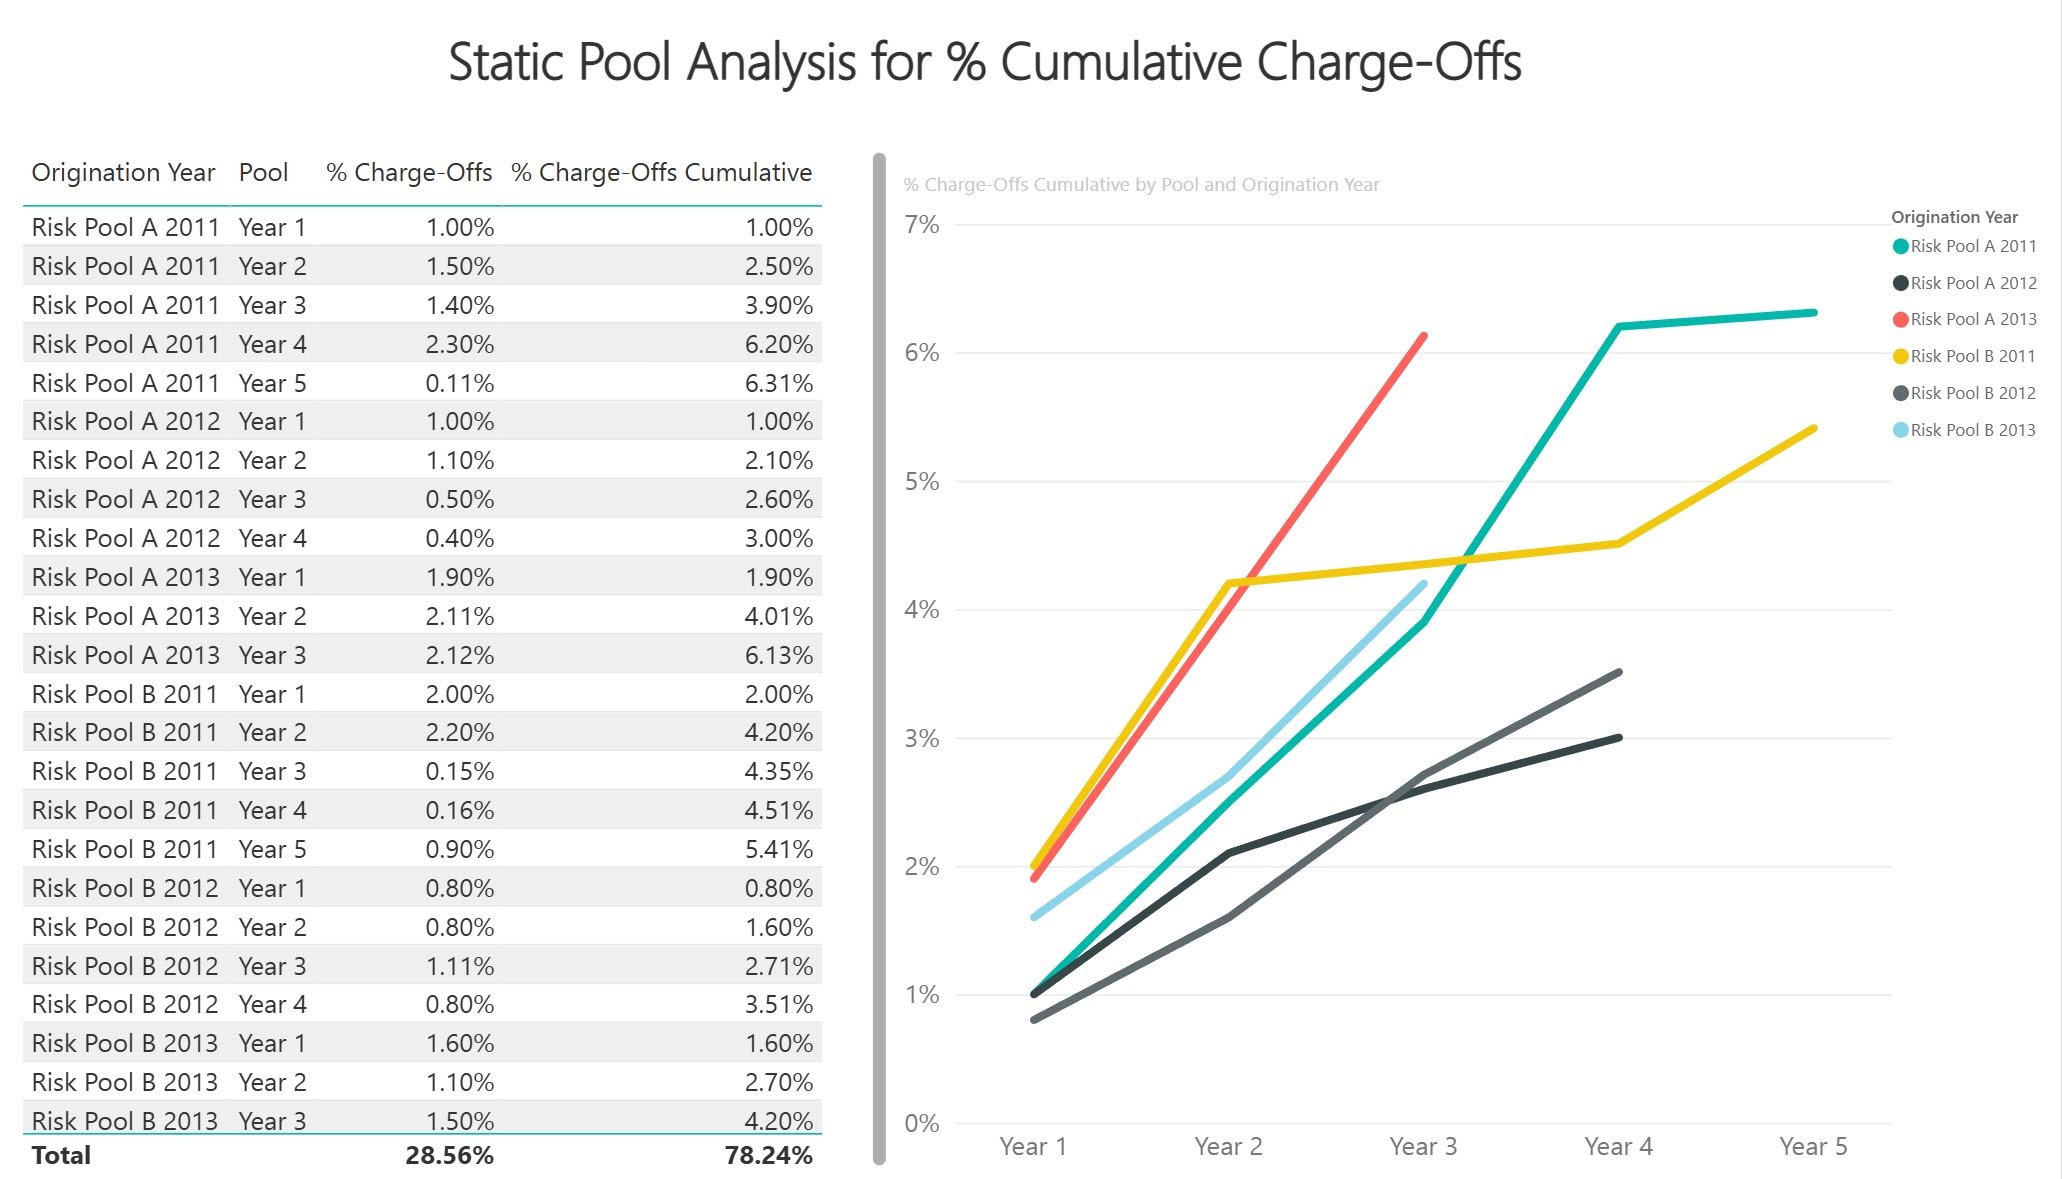
First let's discuss how to read the table above. The origination year is a specific set of loan
attributes that we wish to track. This could be a certain demographic, risk rating, interest rate or
other sub segment of the pool. The important point is for the segments to represent an action,
decision or strategic direction that is important and key to the organization's goals. In the
columns, the actual and cumulative percent charge-offs are tracked by year and origination-to-date.
In year one, the charge off values are for the first year of that pool. Then for every year we take
each value and sum year over year.
In this example, the chart visualizes the trajectory of the health of the portfolio. If we read the
chart from left to right, it shows that Risk Pool A for 2011 started off pretty good but quickly
gained charge-off momentum and is now fairly stable. In 2012 apparently, some changes were made to
how lending is originated and serviced and those numbers are much lower as of year four. For the
loans that were originated in 2013 there needs to be immediate action on the servicing side since
they are on track to be very badly performing. However, this may be expected and may still be
profitable depending on the interest rate and other factors.
Understanding the Trajectories
Remember, since we are talking about cumulative values, the trajectories of the pools will never go
down, only up. Meaning, in our example, it's doubtful the cumulative charge-offs for Risk Pool A of
2013 will ever be as good as say, Risk Pool A of 2011. Another point to note is how this type of
analysis reaches across the full lifecycle of the business process and in this case, is also cross
functional as it touches marketing, sales, origination and servicing. A drill down into the
individual processes that support the chart might show how to improve campaigns, terms and customer
service.
How can you take advantage of static pool analysis? Always start with your organization's strategic
goals and determine the different processes and points of measurement along the line. This can be
done with a strategy mapping exercise. Often these metrics will be percentages, indexes or rates
since these can be normalized over time. You will want to identify at least two date data points and
their periodicity. In our example above it might be more useful for our origination dates to be more
granular such as the month level and then the cumulative metrics at the three month, 6 month and
then yearly after that. It really depends on the metrics being tracked and how often tweaks to
actions or decisions are intended to be made to affect change.
Technical Perspective
From a technical perspective, the origination pools are represented by a snapshot fact copy of the
data created every month. In this way, the loan pools can be temporally (time) shifted and compared
based on their age or vintage. This approach words best when balances are kept for every
end-of-period whether it be monthly or quarterly. If you are using OLAP data source it becomes
especially easy to aggregate your metrics like profitability, risk ranking and cost load.
Static pool analysis can be used for many other processes and industries. It could be used to track
cumulative hotel guest satisfaction based on monthly marketing campaigns, patient bad debt or
charity care for healthcare, or customer scheduled maintenance for auto dealerships. Not to say the
list is endless, however, the important point is static pool analysis is not only not just for
financial services but for all industries including leading and lagging indicators.
Click here to see how Power
BI analytics development can improve performance in your organization